Biomarkers
8 min read
What Axo data reveals about hidden health risks

A full read of anonymised Axo data: only 54% of biomarkers optimal on average, 9.6 out of range per person, plus hidden risks like Lp(a) that standard panels miss.

AUTHOR
DM
Dr. Daniel Müller
Medical Advisor
REVIEWED BY
DM
Dr. Daniel Müller
Medical Advisor
UPDATED
June 26, 2026
Share

This report draws on anonymised, aggregated Axo data. No individual is identifiable, and figures are reported only at the level of the whole group.

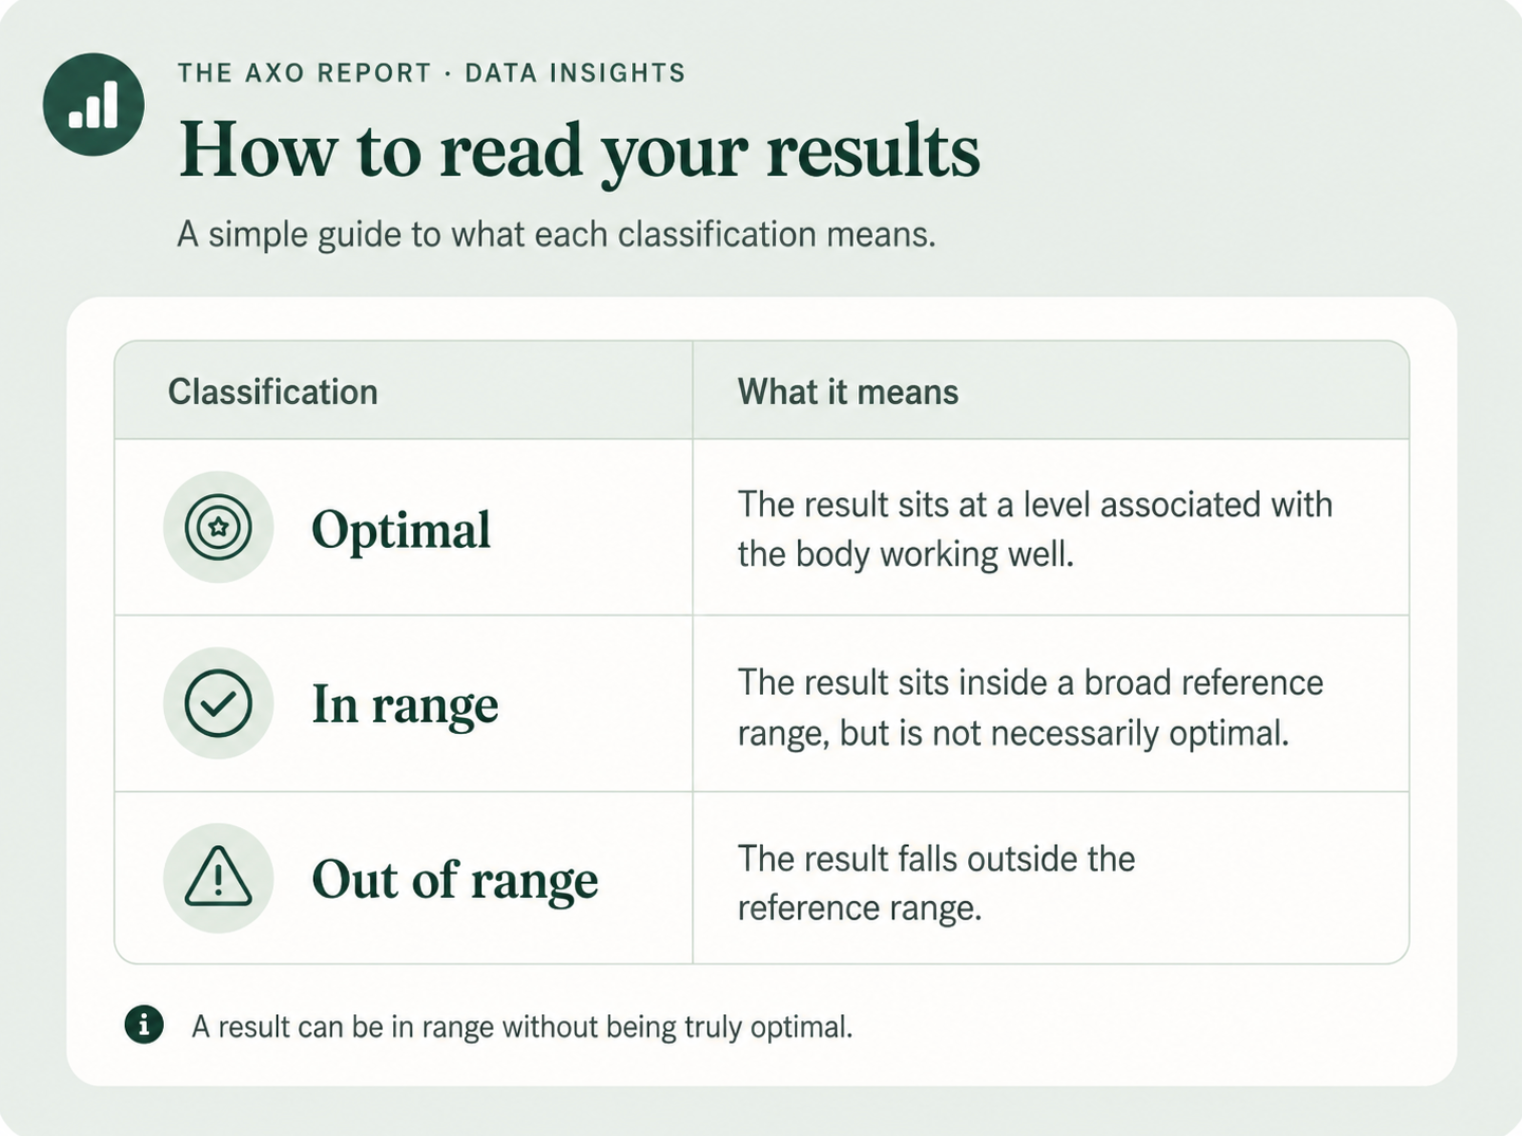
Three classifications are used throughout, taken directly from Axo's clinical reference ranges:

  • Optimal: the result sits at the level associated with the body working well, not merely the absence of disease.
  • In range: the result falls inside the wide reference band a standard test uses to rule out disease, but is not necessarily optimal.
  • Out of range: the result falls outside that reference band.

Two summary measures appear in places. 

  • Health score is the share of markers that are optimal or in range. 
  • Optimal rate is the share at the optimal level only. Every percentage is calculated among the people actually tested for that marker, not the whole group, and figures are rounded.